/ Social Media Projects

Accounts that grow — numbers that hold up.

Every engagement here is ongoing. We track what lands each week and adjust before the next post goes out — not at the next contract review.

Close-up of a desktop monitor screen displaying a LinkedIn company page with a graph showing follower growth from 1,200 to 4,800 over six months, office desk environment, natural side lighting, crisp screen glow
Wide shot of a tablet propped on a retail studio desk showing an Instagram analytics screen with engagement rate trending upward, product packaging visible softly out of focus in the background, clean studio lighting from above
Overhead process shot of a desk with a printed content calendar, handwritten weekly notes, and a laptop open to a Facebook Page insights dashboard showing reach and impressions climbing month over month, natural window light casting soft shadows
— Client Engagements

Three accounts. Consistent growth.
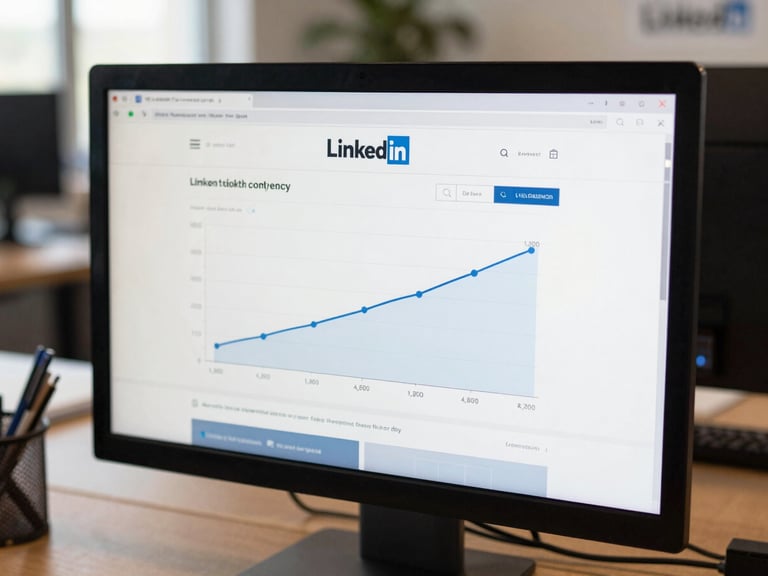
B2B SaaS — LinkedIn

Meridian Analytics

Follower count grew from 1,200 to 4,800 in six months. Post reach up 310%. Weekly content calendar built around product release cycles, adjusted each Monday based on prior-week data.
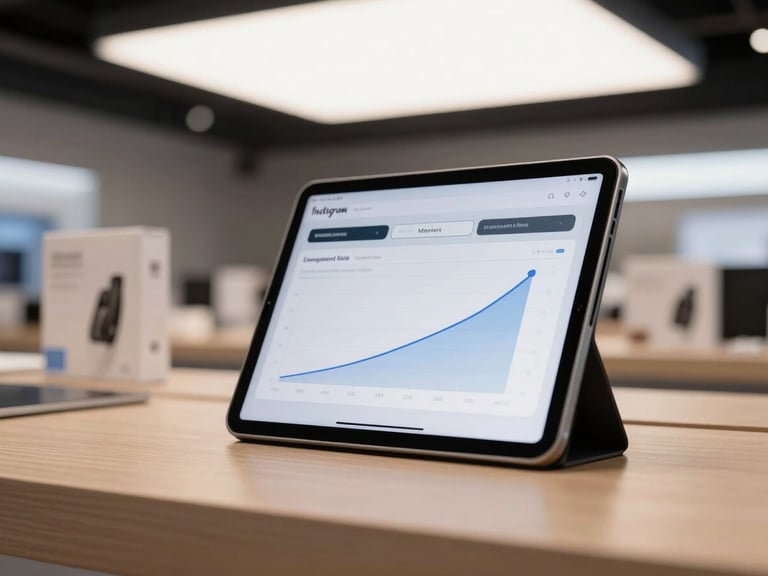
Retail Brand — Instagram

Crestfield Co.

Engagement rate moved from 1.1% to 3.7% over eight months. Story views doubled by month four. Posting cadence held at five times per week with zero missed slots across the engagement.

Professional Services — Facebook

Harlow & Vance Group

Monthly reach increased 4x in the first quarter. Lead-gen form submissions up 88% by month six. Content mix refined weekly based on reach-to-engagement ratio, not gut feel.

▸ Across All Managed Accounts

Numbers from live engagements.

3.2×

52 Weeks

4.9 Stars

Average follower growth multiplier across all accounts within the first six months of management.

Zero missed weekly reviews across all active accounts since our first managed engagement launched.

Aggregate rating across international review platforms from clients we manage social for.

Ready to hand off your social — and actually see it grow?

Our social management engagements are ongoing, not one-time. See the full scope of what's included before you request a proposal.